Lesson Objective
- Understand how analogue sound is converted into digital sound.
- Describe how sample rate and resolution affects the quality and the file size.
- Calculate the file size of an audio file.
KS3, GCSE, A-Level Computing Resources
measures changes in air pressure. Microphone translates air pressure into electrical voltage (binary). Analogue to digital converter digitises the electrical voltage to bytes of information.
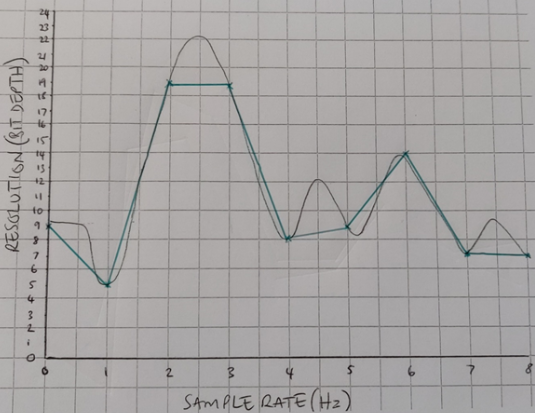
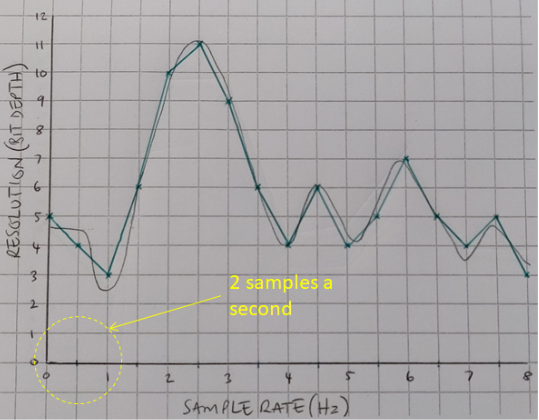
Resolution measures the amplitude of a sound wave. The resolution is measured on the Y axis of the sound wave graph on the right.
The green line on the graph represents the digital form of the analogue sound.
The sound wave on the right is digitised into a sound file that records 1 sample a second, with a 3 bit sound resolution (you need 3 bits to represent all the number of the Y axis).
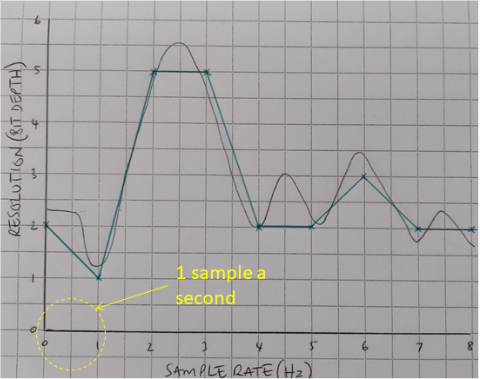
When you increase the resolution, you can represent the amplitude of the sound wave more accurately. This is demonstrated in the graph to the right.
The more you increase the bit depth/resolution, the more accurately you will be able to recreate the analogue sound. However, increasing the resolution on its own will not be enough to have an accurate digital representation of the analogue sound wave represented in the graph.
Hertz (Hz) - How many samples are taken every second
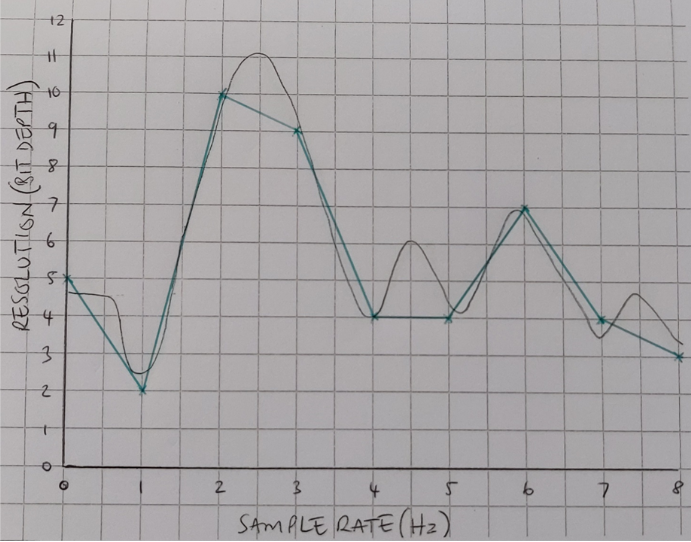
The sample rate refers to the amount of measurements that are taken every second. They are represented on the X axis of the sound graphs. The sound graph on the right represents audio that records 2 samples a second. The length of the audio is also measured on the X axis (in seconds).
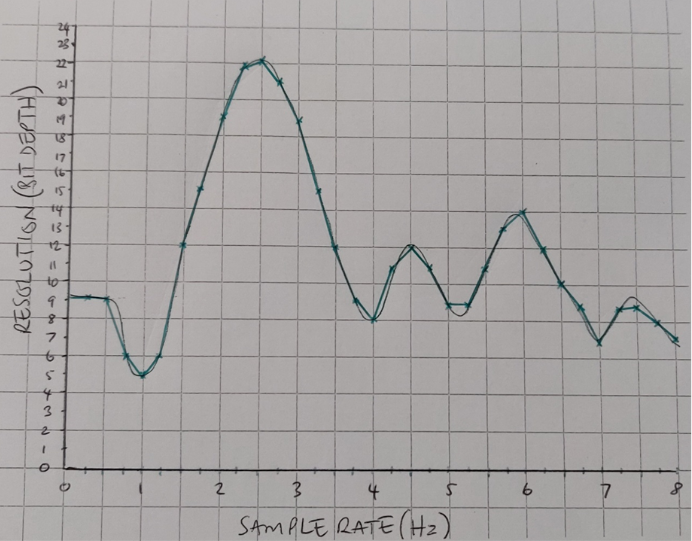
The digital representation of the audio gets more accurate when the sample rate is increased. The graph on the right shows a recording of 4 samples a second.

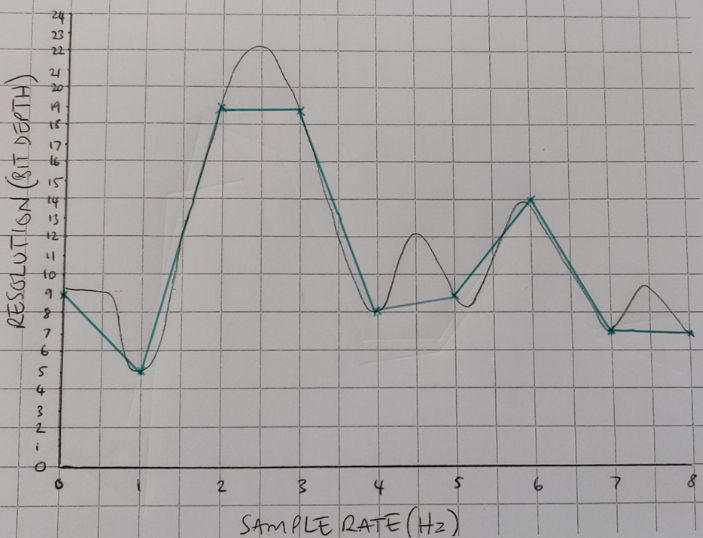
As you increase both the resolution and the sample rate. The digital representation becomes more accurate and the quality of the digital audio increases.
This will also increase the file size of the audio.
Bit depth is the number of bits available for each sample. It is dependent on the resolution of the audio which is recorded on the Y axis on the sound graphs. If the resolution Y axis goes up to 24, then the bit depth will 5 bits because you need 5 bits of binary to represent the number 24. Every time a sample is recorded, the resolution is converted in to binary.
In the example, the resolution will be converted in to a 5 bit binary number.
| Time Sample | 1 | 2 | 3 | 4 | 5 | 6 |
| Resolution | 10 | 17 | 5 | 20 | 7 | 31 |
| Binary | 01001 | 10001 | 00101 | 10100 | 00111 | 11111 |
File size (bits) = sample rate x resolution x seconds
1 samples per second x 5 bit resolution x 8 seconds = 40 bits
40 bits / 8 = 5 bytes
Increasing resolution and sample rate means the quality will improve. It also means the file size will increase.